

Bárðarbunga activity & Holuhraun eruption 2014/15
Seismic activity
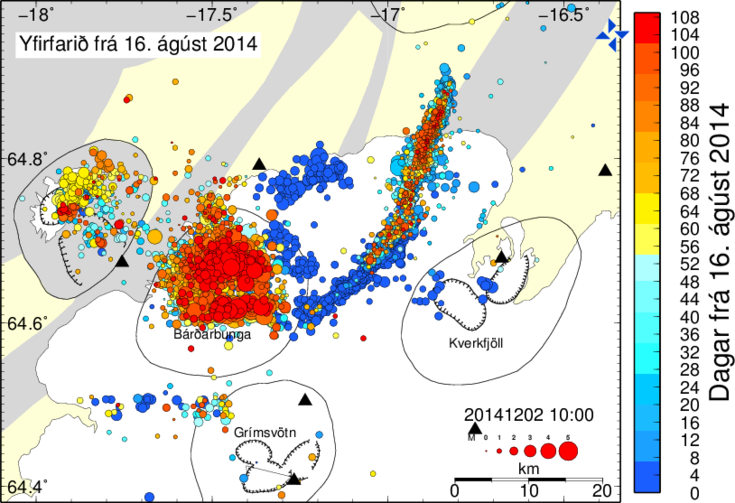
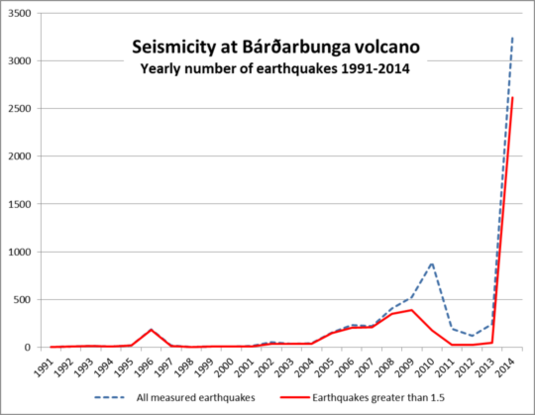
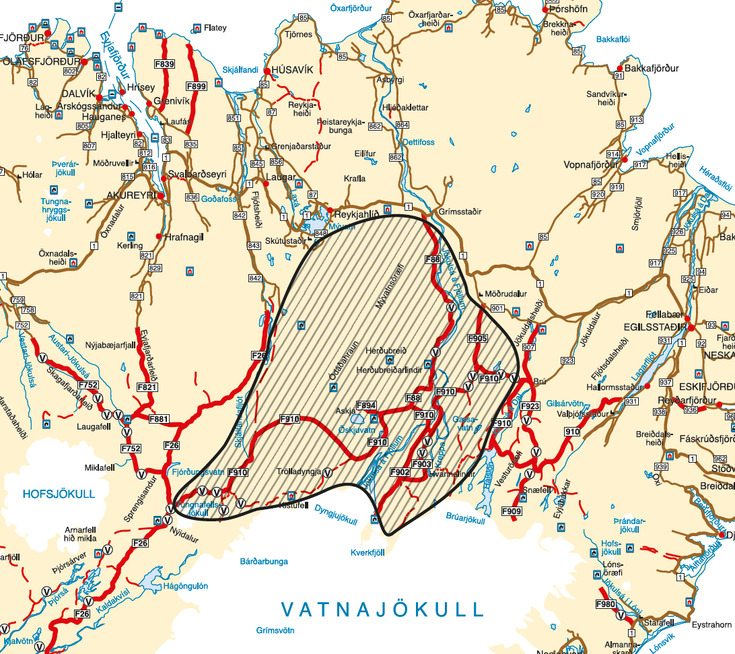
On 16 August 2014 high seismic activity had started at Bárðarbunga central volcano, which is located at the northwestern edge of Vatnajökull and covered with ice.
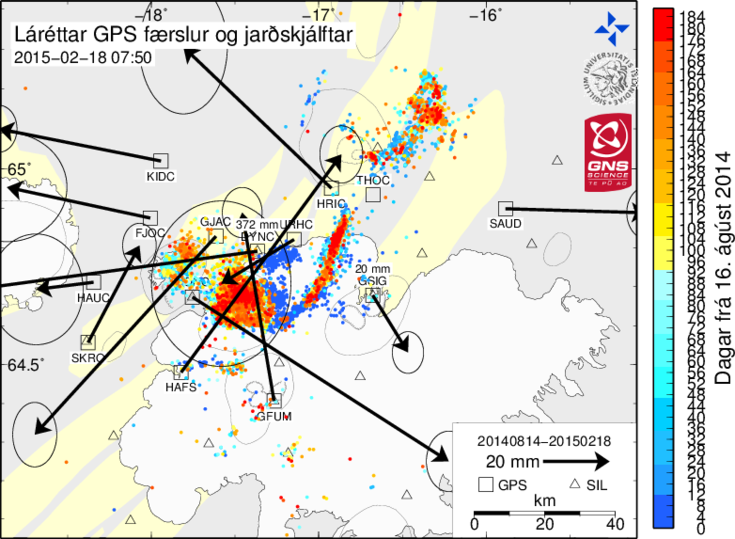
The seismic swarm together with displacements at GPS stations in the northwestern region of Vatnajökull indicate magma movements in Bárðarbunga (www.vedur.is).
Evacuation measures
On 18 August 2014 the aviation colour code of Bárðarbunga was set to orange, the second highest level, which means "Volcano is exhibiting heightened unrest with increased likelihood of eruption".
Two days later the area north of Vatnajökull was closed and evacuated due to a danger of flooding in connection with a possible volcano eruption.
For the actual aviation colour code of active volcanos in Iceland watch the website of the Icelandic Meteorological Office (www.vedur.is/weather/aviation).
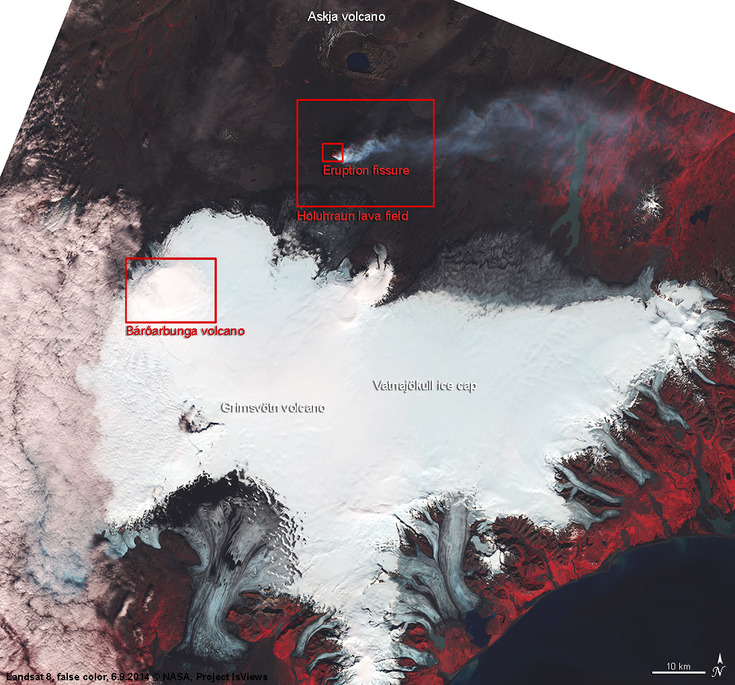
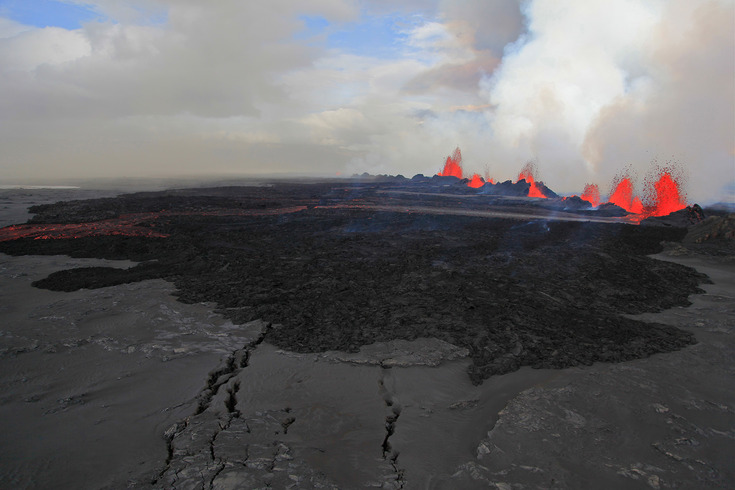
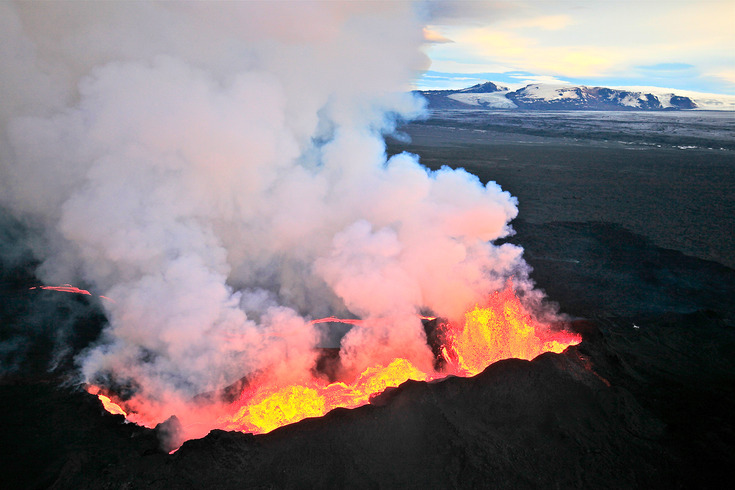
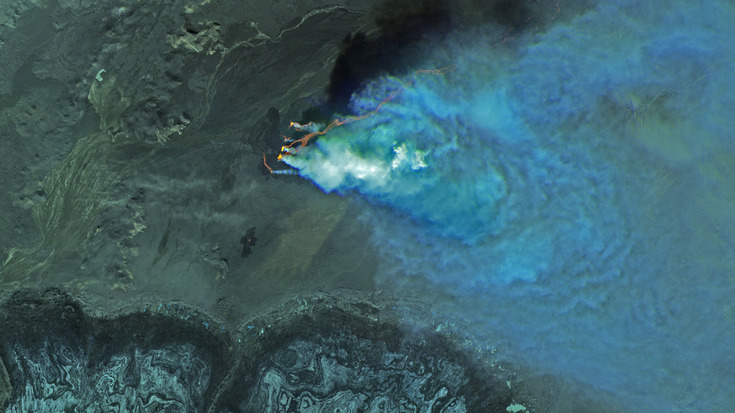
Fissure eruption at Holuhraun
On 29 August 2014 a fissure eruption started about 40 km northeast of Bárðarbunga on the so called Holuhraun plain, which is situated in the forefield of Dyngjujökull outlet glacier.
The lava eruption lasted for 6 months and ended on 27 February 2015.
For more photos of the eruption, taken by a professional photographer in September 2014, see PHOTOS.
For a video of the eruption, recorded by the Icelandic National Broadcasting Service RÚV in November 2014, see LINKS.
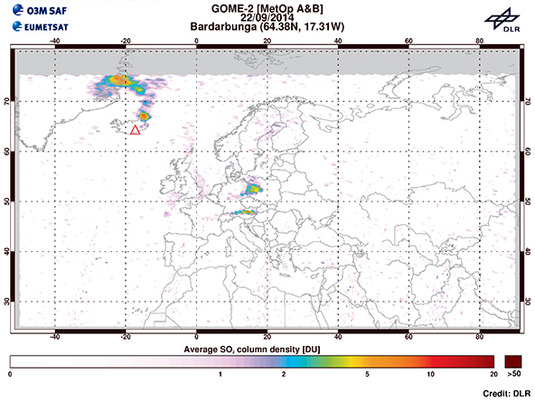
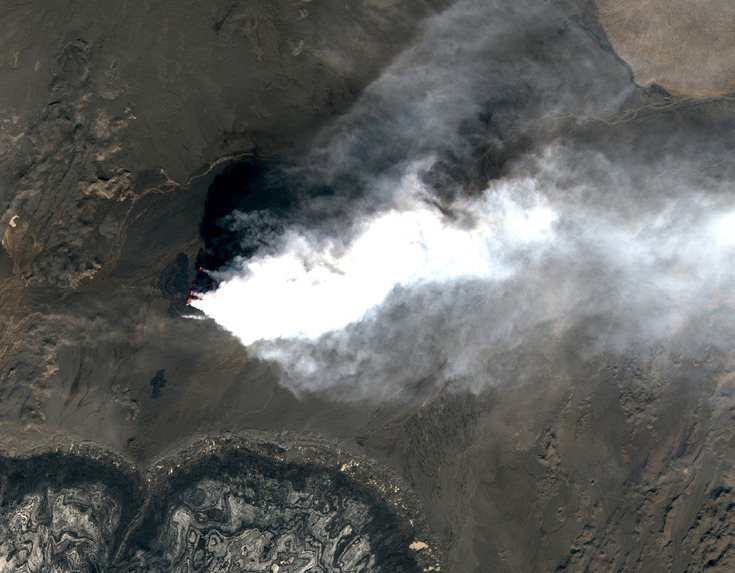
Sulphur dioxide
On 1 September 2014 gas and steam emissions rose to a few hundred meters above the erupion site, extending up to 1.2 km downwind (www.vedur.is).
On 22 September 2014 sulphur dioxide from the Holuhraun eruption even reached Germany, as measured at Zugspitze weather station and monitored by the GOME-2 sensor onboard MetOp A&B satellites, which are analysed by the Earth Observation Center at DLR (www.dlr.de).
Gas concentrations at the eruption site were life threatening and people had to wear gas masks. On 6 October 2014 considerable pollution reached Reykjavík and affected visibility (www.vedur.is).
Gíslason et al. (2015) estimate the total SO2 emissions during the 6 months eruption phase to about 11 Mt, which is more than the amount emitted from Europe in 2011.
Monitoring with remote sensing data
Within the project IsViews there are large amounts of optical and weather independent radar imagery, spaceborne as well as airborne, available for (near real-time) hazard monitoring and research:
- UltraCam Xp aerial image and digital elevation model from 29.08.2014 (11 cm spatial resolution)
- RapidEye image from 6.09.2014 (5 m spatial resolution)
- Repeated Landsat 8 imagery (various canal combinations, 15-30 m spatial resolution)
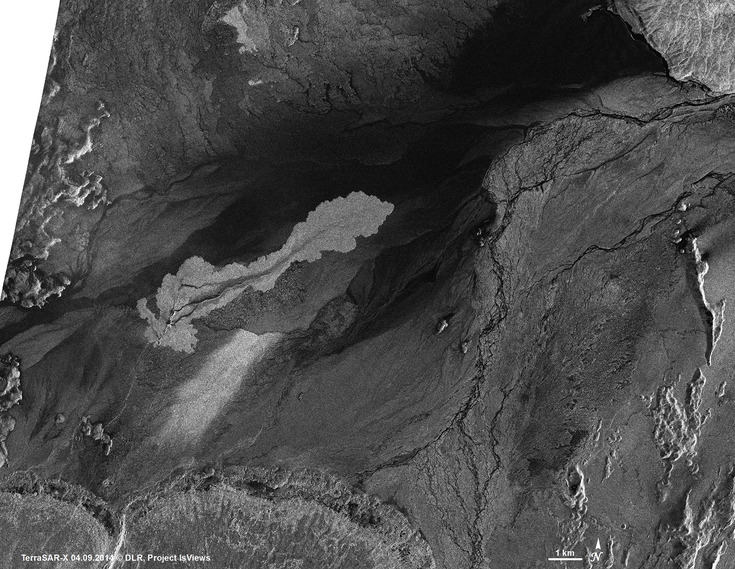
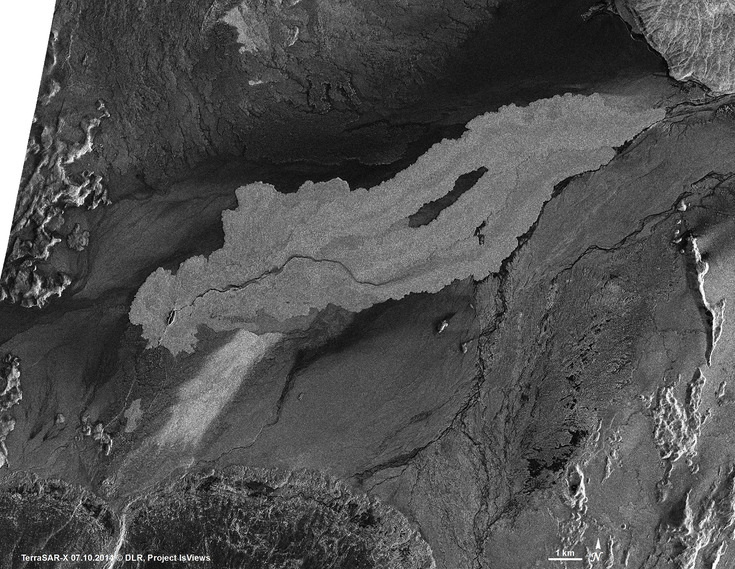
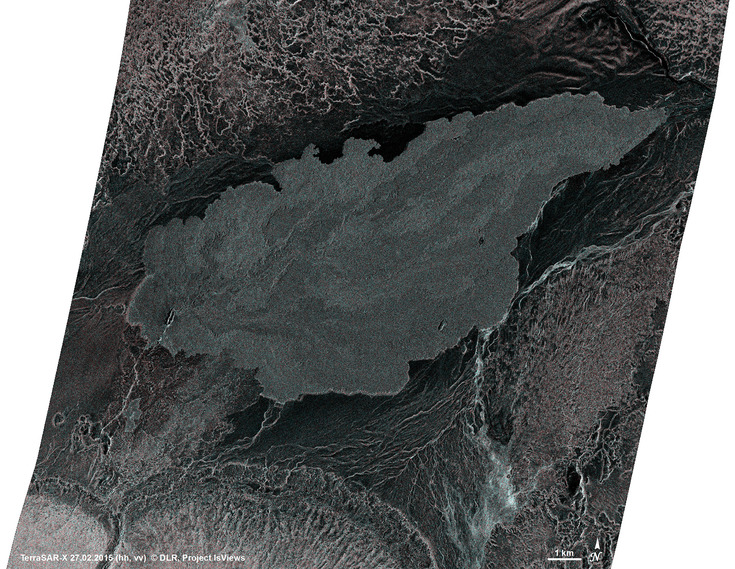
- Repeated TerraSAR-X imagery (single/dual pol, 1.25/2.75 m spatial resolution)
- TanDEM-X data from 14.09.2014 (6 m spatial resolution)
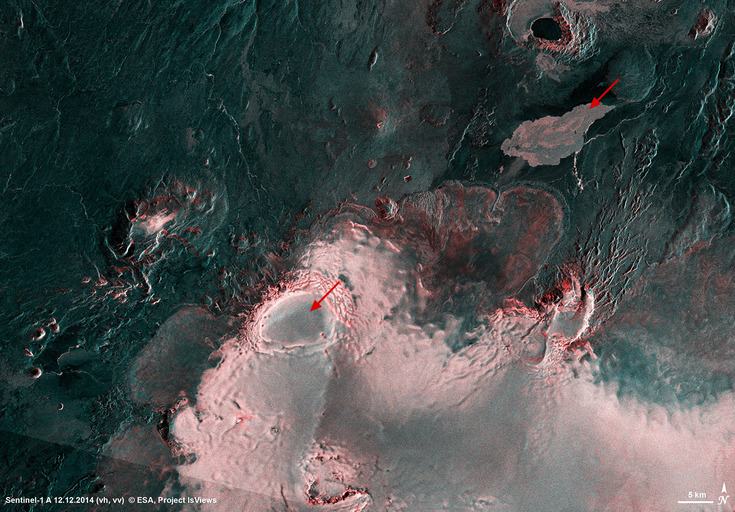
- Repeated Sentinel-1A imagery (10 m spatial resolution)
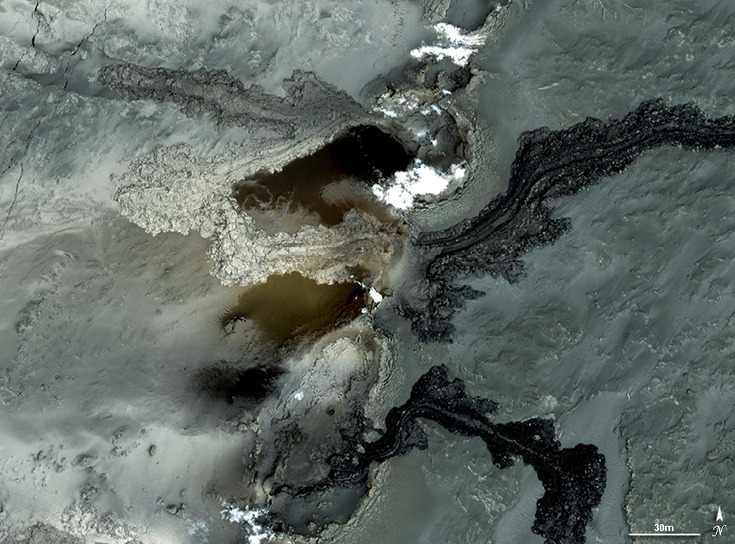
Dual polarized radar imagery, especially the cross polarized Sentinel-1A data, clearly shows differences in roughness of the Holuhraun lavafield.
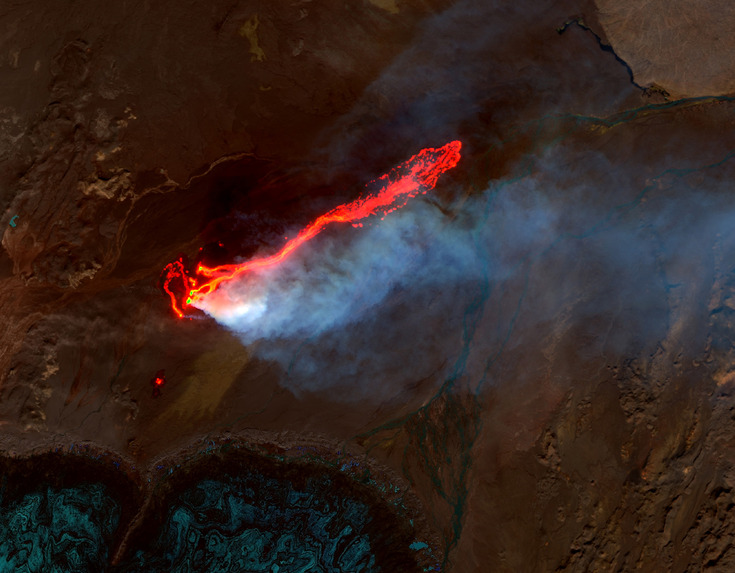
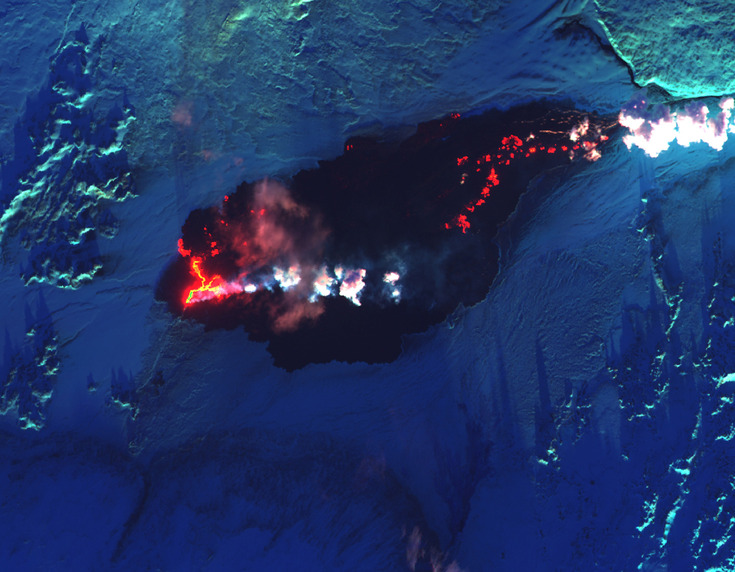
False color optical imagery, including shortwave and near infrared, reveal variations in the temperature of the lava and makes it easier to see through the plume of steam and gas.
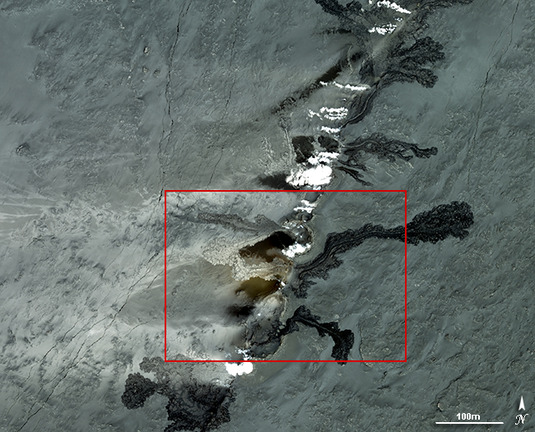
Lavafield growth
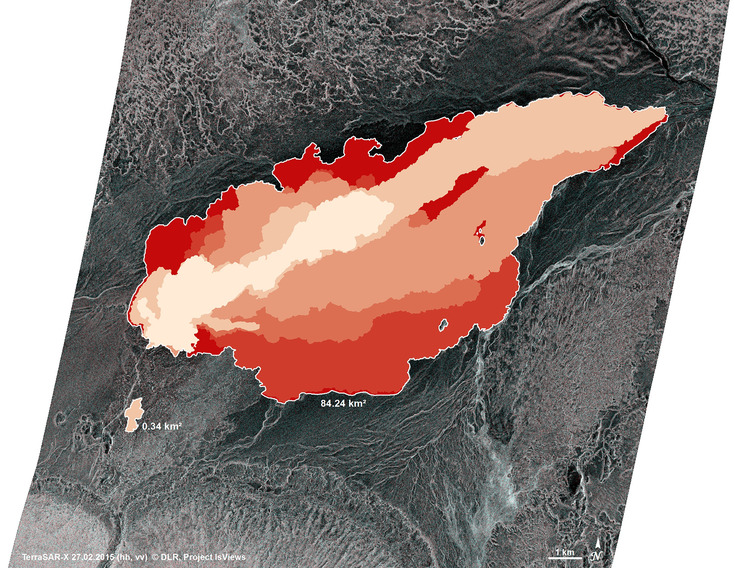
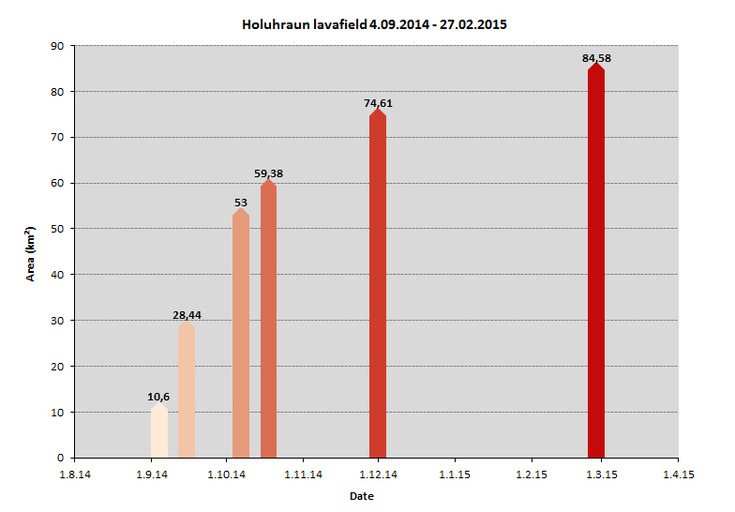
The lava countinously spread over the Holuhraun plain during the six months eruption phase.
A first TerraSAR-X image of the lavafield was acquired on 4 September 2014, six days after the eruption had started. It shows an extend of 10.6 km2.
The maximum extend of the lavafield is 84.6 km2, measured on a TerraSAR-X image acquired on 27 February 2015, the last day of eruption.
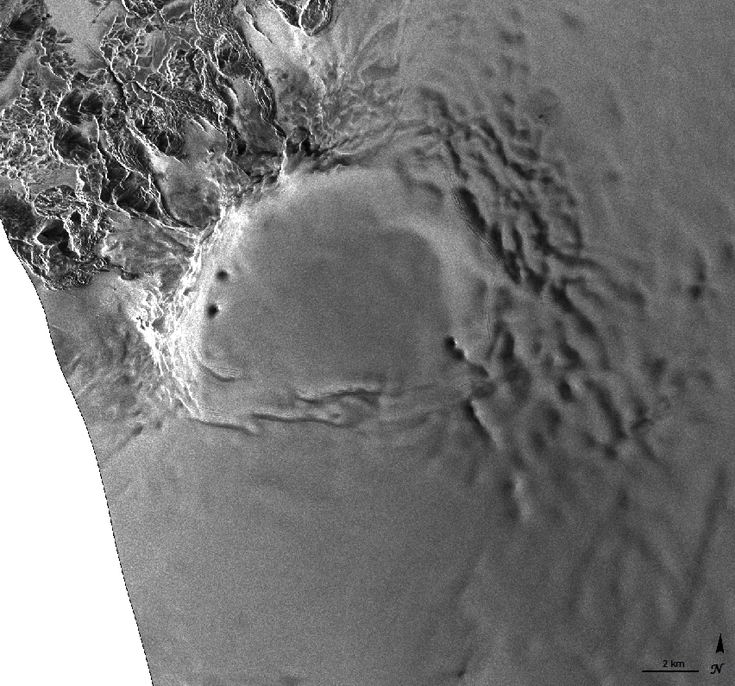
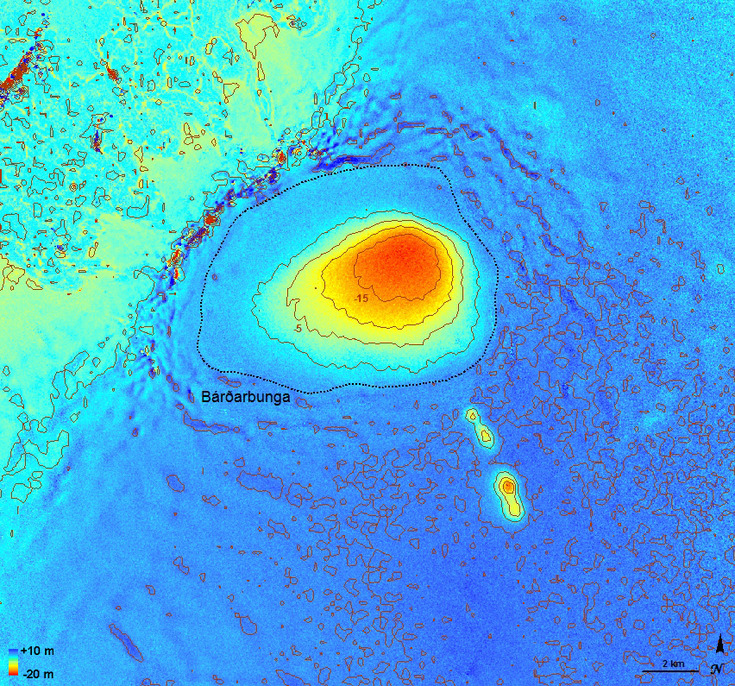
Bárðarbunga depression
With the onset of the high seismic activity and fissure eruption, the ice masses within Bárðarbunga caldera started to subside. The subsidence reached a maximum of 62 m in March (measured by the Institute of Earth Sciences).
The thickness of the ice within the caldera is 600-800 m (measured with ground penetrating radar by Helgi Björnsson, 1992).
The depression is even visible in radar imagery.
For a detailed analysis of the subsidence, measured with TanDEM-X data, see RESULTS.
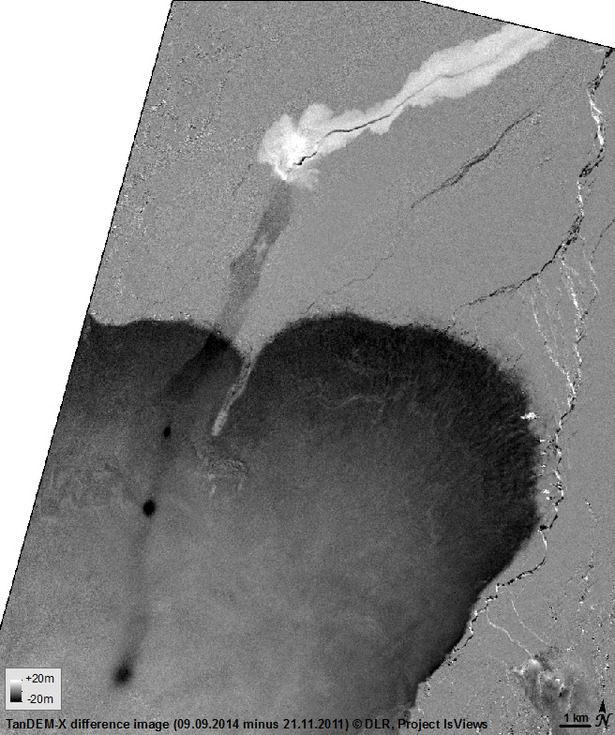
Fracture zone
Along with the Holuhraun fissure eruption a fracture zone emerged southwest of the initial eruption site.
TanDEM-X data differencing reveals that it extends 18 km towards southwest into Dyngjujökull outlet glacier, it is 650-1200 m wide and includes three ice cauldrons up to 30 m deep.
For more information and maps see RESULTS.
Selected newspaper articles
- Iceland Review
- Morgunbladid
- BR Wissen (German)